Comprehensive life-management dashboard — one calm place for everything that matters
Modern life is managed across five, seven, ten separate apps — each one demanding attention, each one sending reminders that disappear into noise. LifeTrack was built on a single, uncomfortable truth: the cost of a fragmented life isn’t just inconvenience. It’s anxiety, late fees, missed renewals, and the constant feeling that something important is about to slip through.
What is LifeTrack?
A unified life-management dashboard that brings clarity to chaos — health, finance, home, vehicles, documents, devices, and subscriptions in one calm system
LifeTrack is a comprehensive web dashboard designed to consolidate all life-maintenance responsibilities into a single, prioritised view. Instead of tracking vehicle insurance in one app, health appointments in another, subscription renewals in a calendar, and document expiries in a spreadsheet — LifeTrack surfaces everything that needs attention, ranked by urgency, in one place.
The core design insight was deceptively simple: people don’t need more reminders. They need clarity. The difference between “you have 14 notifications” and “3 things need your attention this week, here they are” is the entire product.
This case study documents the full journey — from research and persona development through information architecture, visual design system, usability testing, and measured outcomes.
The average working professional in urban India manages their life across 7–12 different apps, tools, and mental notes. They pay late fees they shouldn’t pay. They miss renewals they knew were coming. They feel constantly behind. Not because they’re disorganised — but because the tools they use are.
Life management is broken
by design.
Four compounding failures that LifeTrack was built to solve — each observed and documented in research
The pattern across all four problems was the same — the system was failing users, not the other way around. The question wasn’t how to add more reminders. It was how to replace uncertainty with instant clarity.
“Managing life shouldn’t feel like a full-time job. I have subscriptions I forgot about, insurance I almost missed, documents I can’t find. I just want to see everything in one place.”
— Research Participant · Software Engineer · Bengaluru · 29 · Interview 03Before designing a single screen, I spent time understanding how people actually manage their lives — not how they think they should. The research revealed a consistent, painful pattern: smart, capable people failing at routine life tasks not because of carelessness, but because the system was never designed to help them succeed.
Listening to people who already tried
and failed.
Multi-method research designed to understand the real cost of fragmented life management
| App | Unified Dashboard | Urgency Indicators | Multi-Domain | Visual Status | Quick Actions | All Domains | LifeTrack Gap |
|---|---|---|---|---|---|---|---|
| Notion | Partial | ✗ | Partial | ✗ | ✗ | ✗ | ✗ |
| Todoist | ✗ | Partial | ✗ | Partial | Partial | ✗ | ✗ |
| Google Calendar | ✗ | Partial | ✗ | ✗ | ✗ | ✗ | ✗ |
| Mint / Money App | ✗ | ✓ | ✗ | Partial | ✓ | ✗ | ✗ |
| HealthifyMe | ✗ | Partial | ✗ | Partial | ✗ | ✗ | ✗ |
| Reminder Apps | ✗ | ✓ | ✗ | ✗ | ✗ | ✗ | ✗ |
| LifeTrack | ✓ | ✓ | ✓ | ✓ | ✓ | ✓ | All 6 ✓ |
Every existing tool solves for one fragment of the problem — Mint handles finance, Calendar handles dates, Notion handles notes. None provide a unified, urgency-aware view across all life domains. LifeTrack’s advantage isn’t any individual feature — it’s being the only tool that treats all 8 life domains as one interconnected system.
The problem was never that people didn’t care about their responsibilities. The problem was that the tools were designed around data, not around attention. LifeTrack flips this entirely — designed around what deserves your attention right now, not what exists in your records.
Meet Ananya.
The primary persona — built from 8 user interviews — urban, capable, overwhelmed, and entirely underserved by every tool she’s tried
A working professional juggling career, finances, health, and daily responsibilities. Tech-savvy but overwhelmed by fragmented tools and notification fatigue. She manages everything — just never feels on top of anything. She’s tried Notion, Google Calendar, multiple reminder apps, and a spreadsheet phase that lasted three weeks. Nothing has stuck.
Urban Professional Tech-Savvy Deadline-Anxious Multi-App SurvivorDesigning the system
before the screens.
Four phases — from discovery to delivery — with user flows, wireframes, and iteration at every step
Mapping where the system fails Ananya
Insurance renewal was chosen as the primary mapping scenario because it represents the most painful and costly failure mode — it involves multiple awareness barriers, a hard deadline, and a direct financial consequence when missed. It was the incident most commonly cited across all 8 interviews.
| Stage | User Action | Feeling | Pain Point | LifeTrack Response |
|---|---|---|---|---|
| Awareness | Receives renewal email / SMS | 😐 Easy to ignore | Lost among other notifications | Dashboard alert with visual priority badge |
| Tracking | Searches through old emails for details | 😤 Frustrated | Time-consuming, information scattered | Automatic tracking with centralised record |
| Decision | Tries to assess how urgent it is | 😰 Unsure | No clear urgency signal — guessing | Colour-coded status badge + countdown timer |
| Action | Delays action, pays renewal late | 😔 Guilty | Late fees and unnecessary penalties | One-click “Renew Now” CTA from the card |
| Outcome | Feels stressed and behind | 😓 Overwhelmed | Negative emotional experience compounds anxiety | Calm completion feedback · “All sorted ✓” |
Before building any hi-fi screens, the IA and core layout were validated in lo-fi. Two critical decisions changed between wireframe and final design based on what testing revealed.
Decision 01 — Cards vs Table LayoutThe answer wasn’t another reminder system. It was a clarity system. One where the question “what needs my attention right now?” is answered in under five seconds — without reading, searching, or remembering. Everything Ananya needed, with the cognitive load she couldn’t afford to carry.
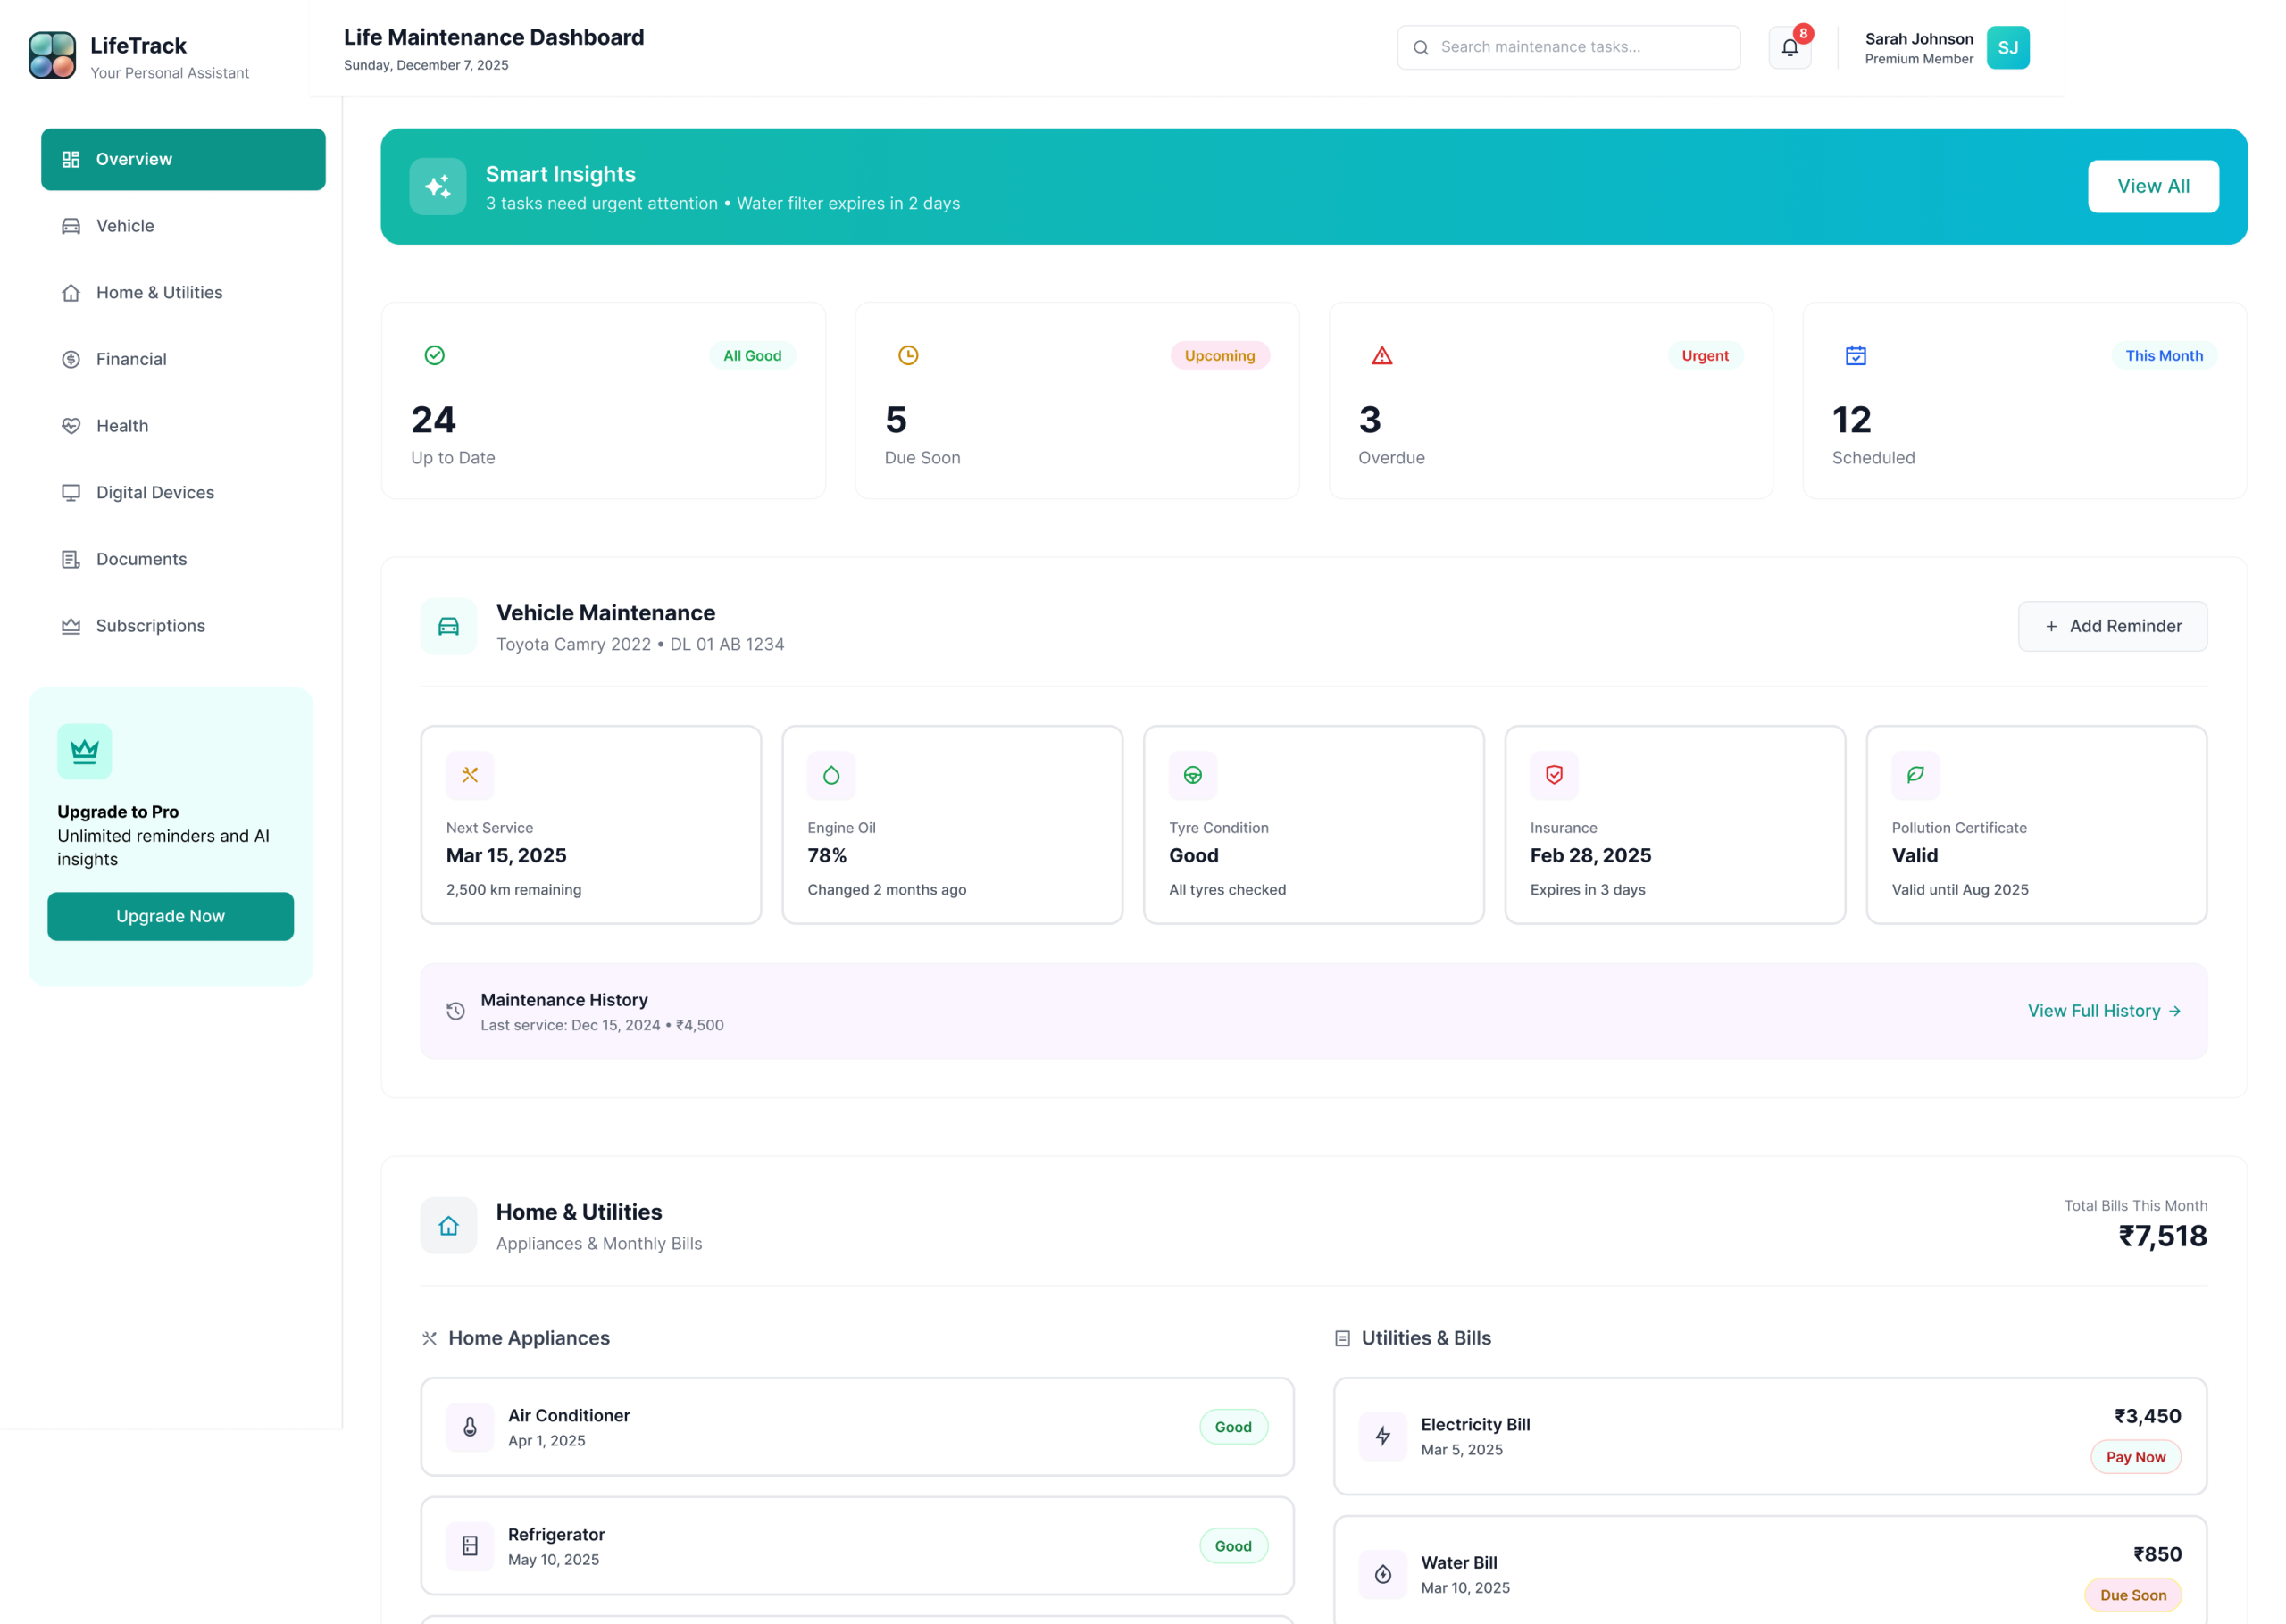
LifeTrack Dashboard
A unified life-management platform that consolidates all life maintenance into one prioritised, scannable, calm interface — replacing 5–8 scattered apps with a single system
LifeTrack doesn’t add more reminders to your life. It provides clarity. The colour-coded status system lets users understand their entire life situation in seconds — transforming life management from a source of stress into a source of calm control.
Eight modules. One design language. Every screen built around the same question — does this make the right action obvious, and does it do so without making the user feel overwhelmed? Hover to pause the scroll and explore.
8 modules. One calm system.
High-fidelity screens built in Figma — each module following the same card-based pattern, the same status badge system, and the same scannable hierarchy. Consistency as a feature.
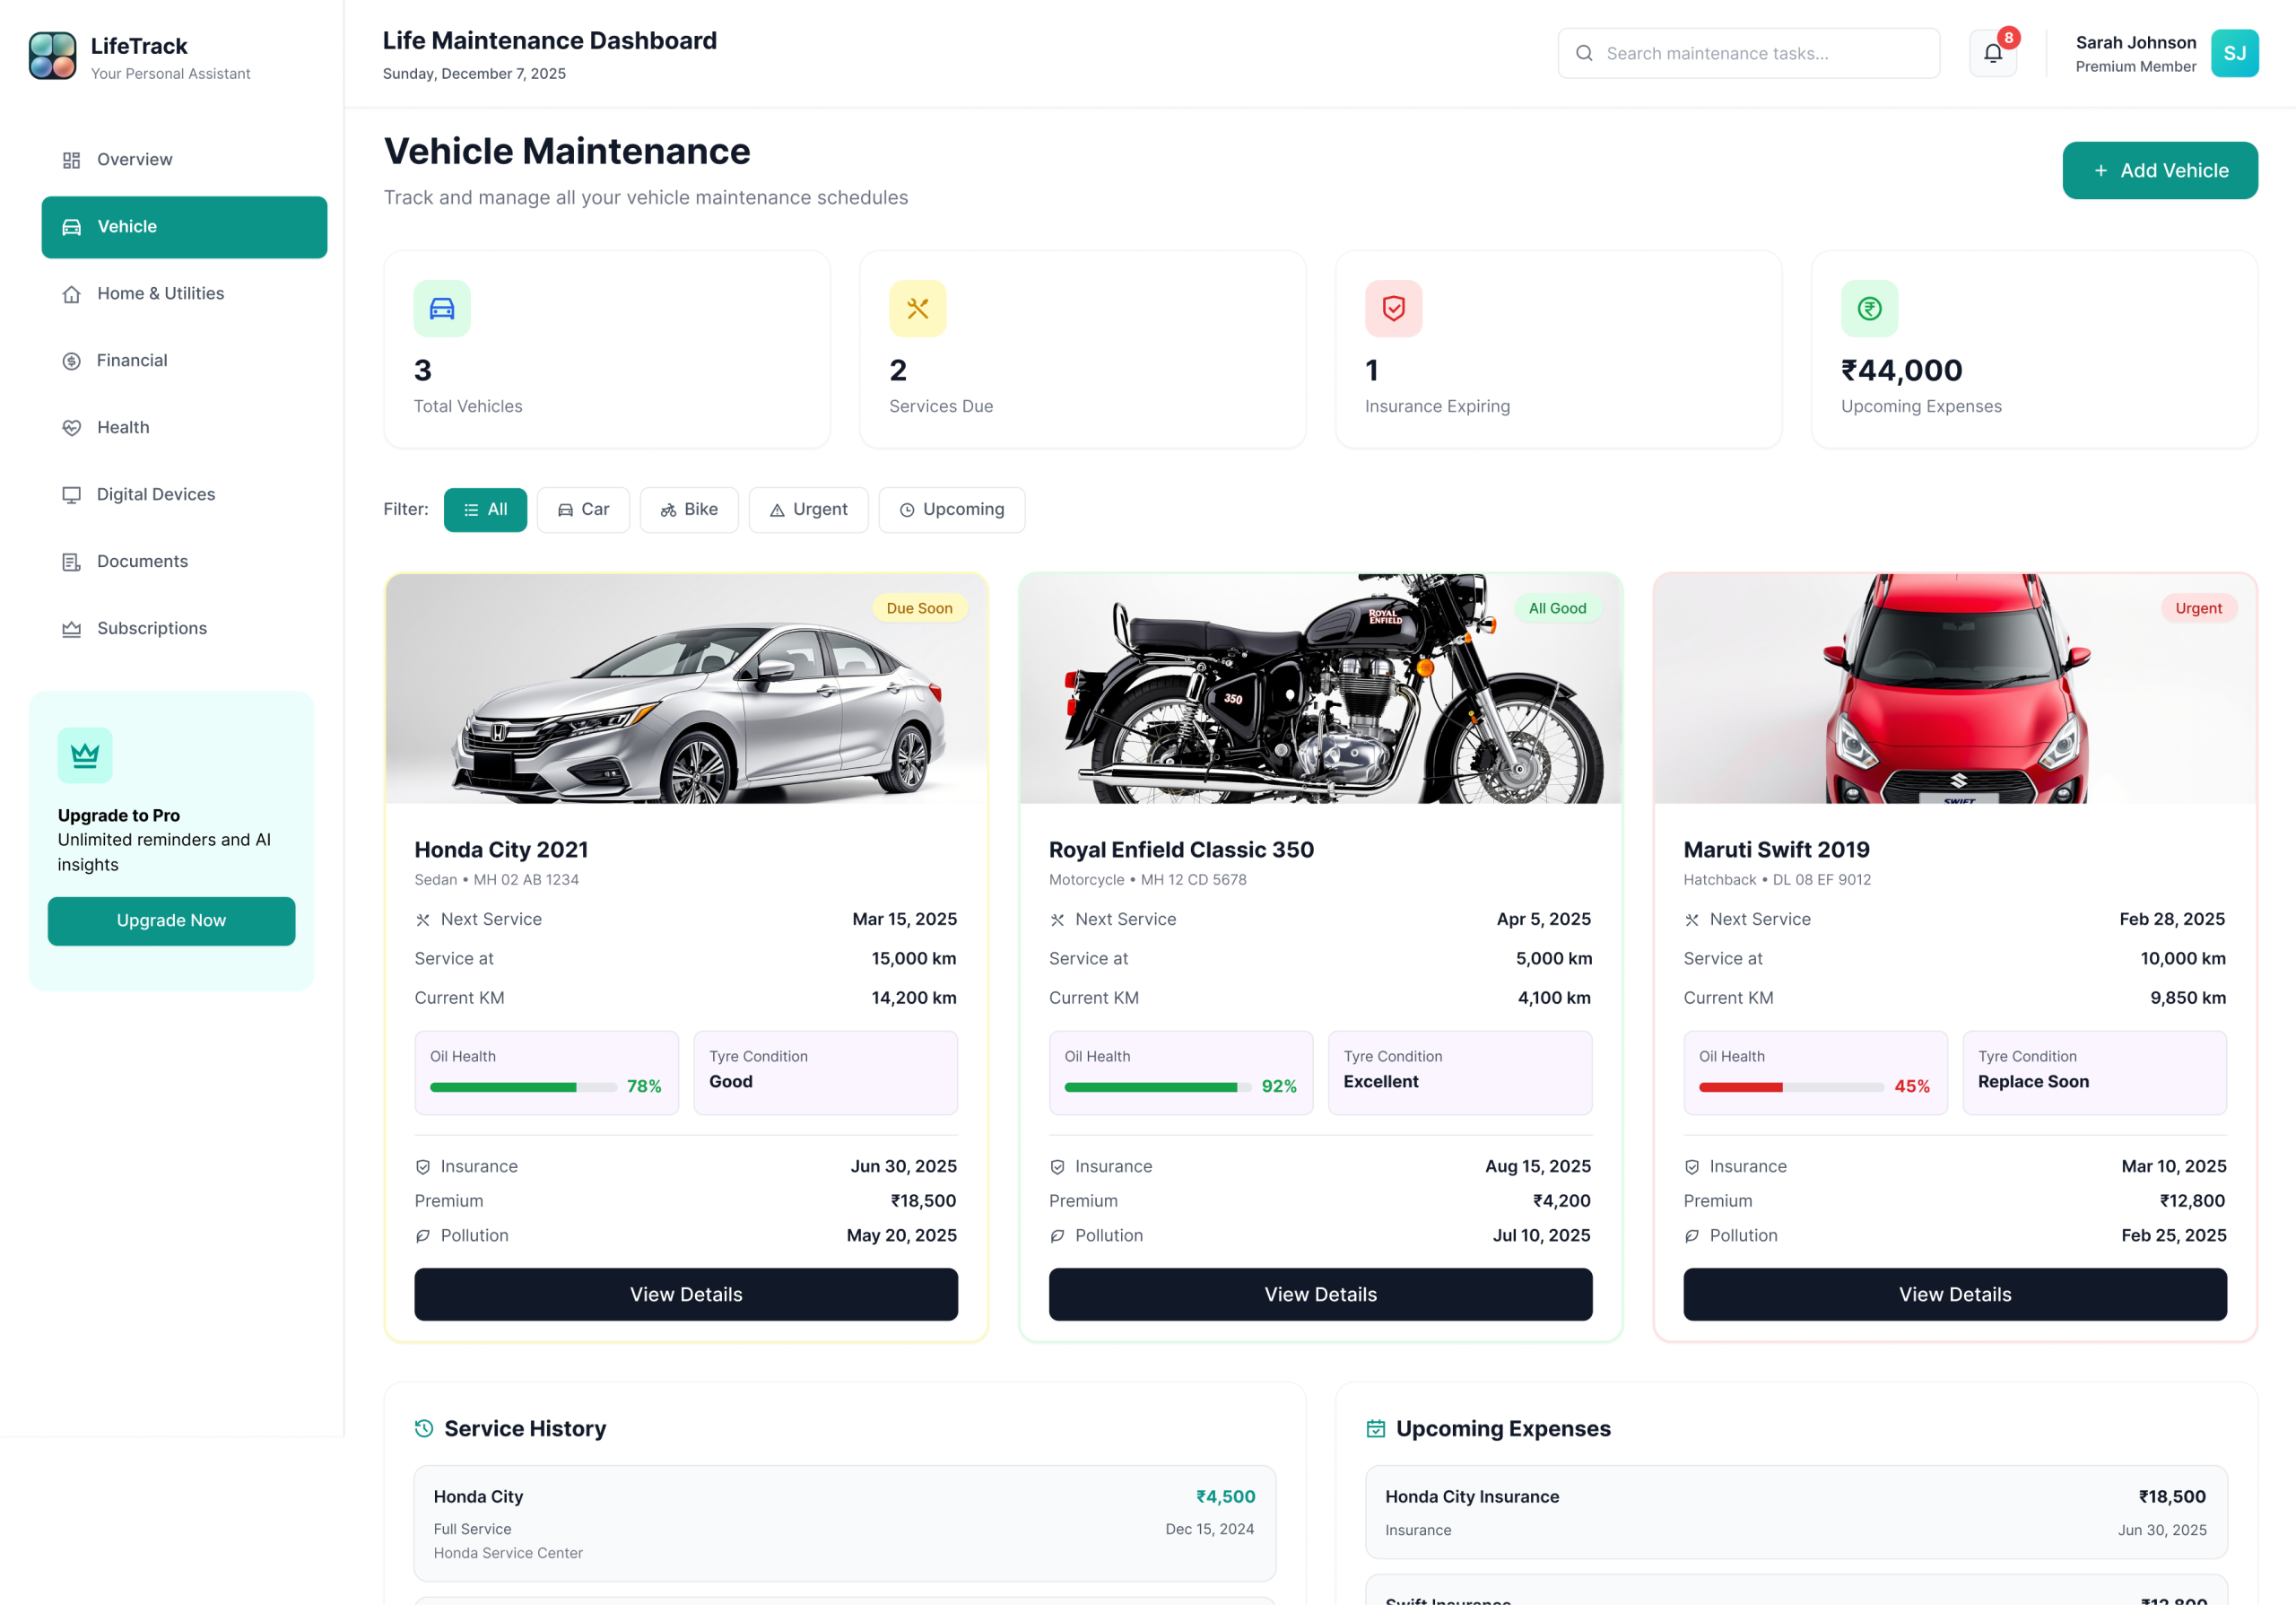
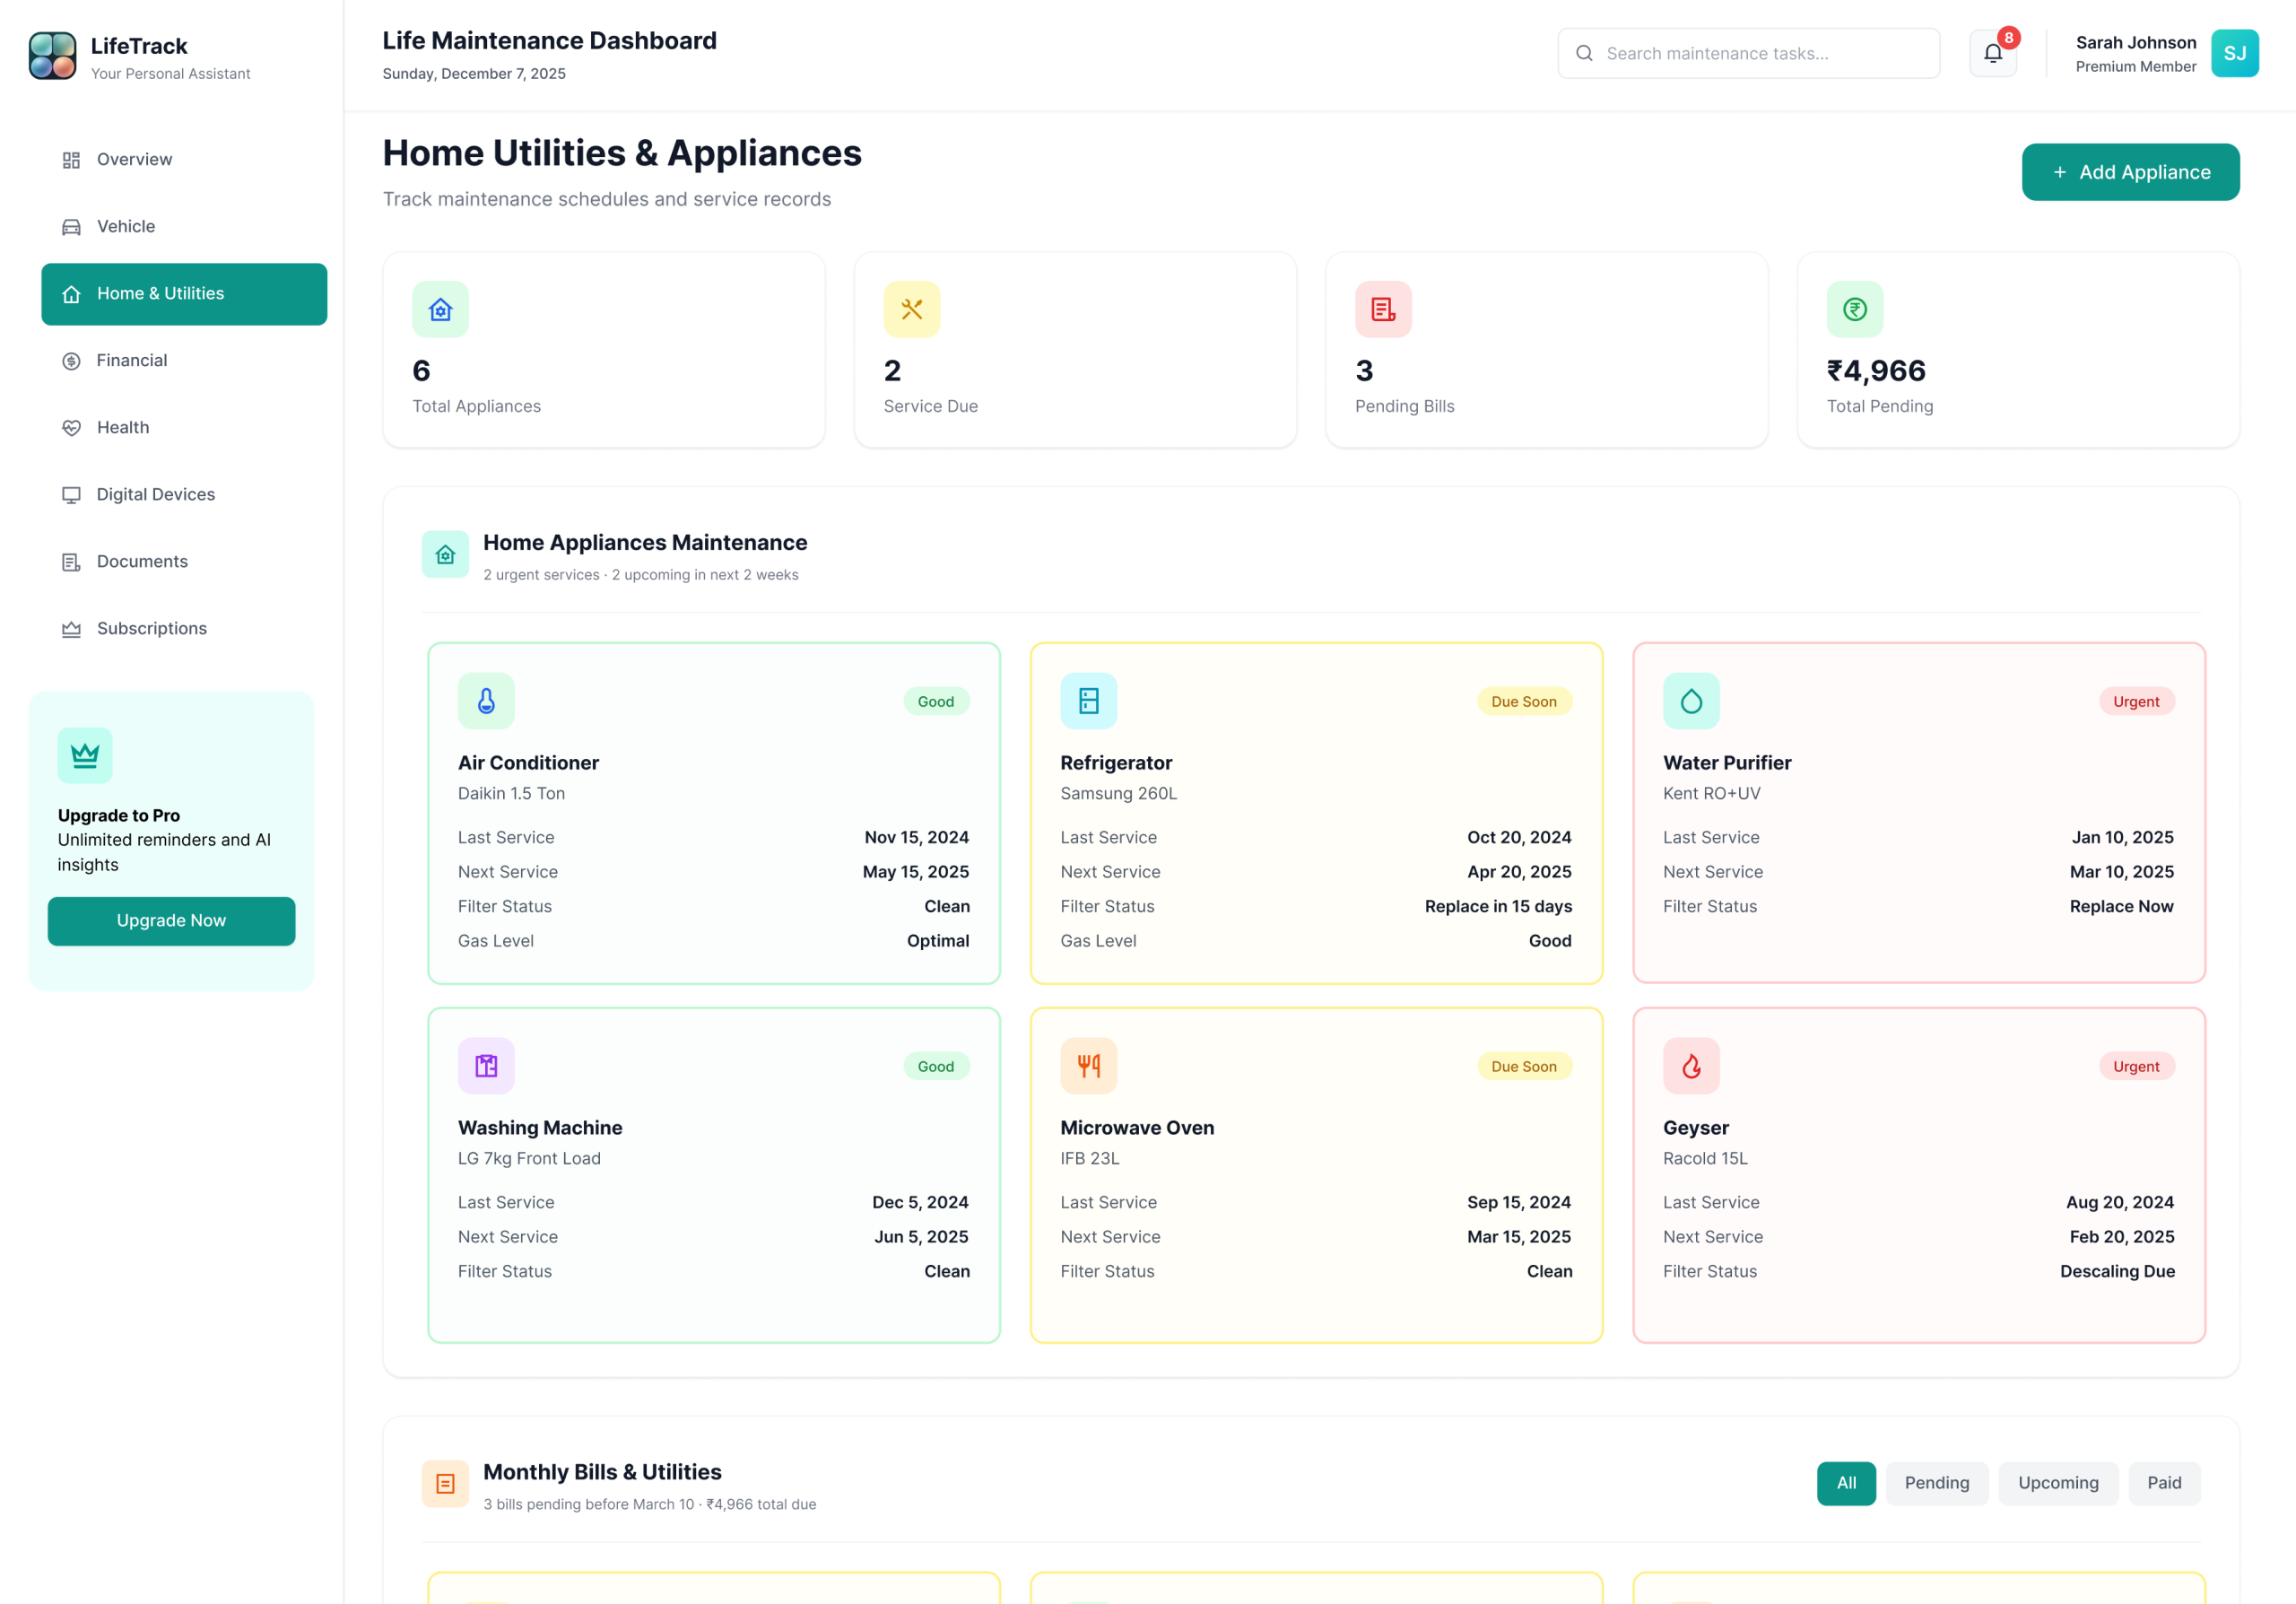
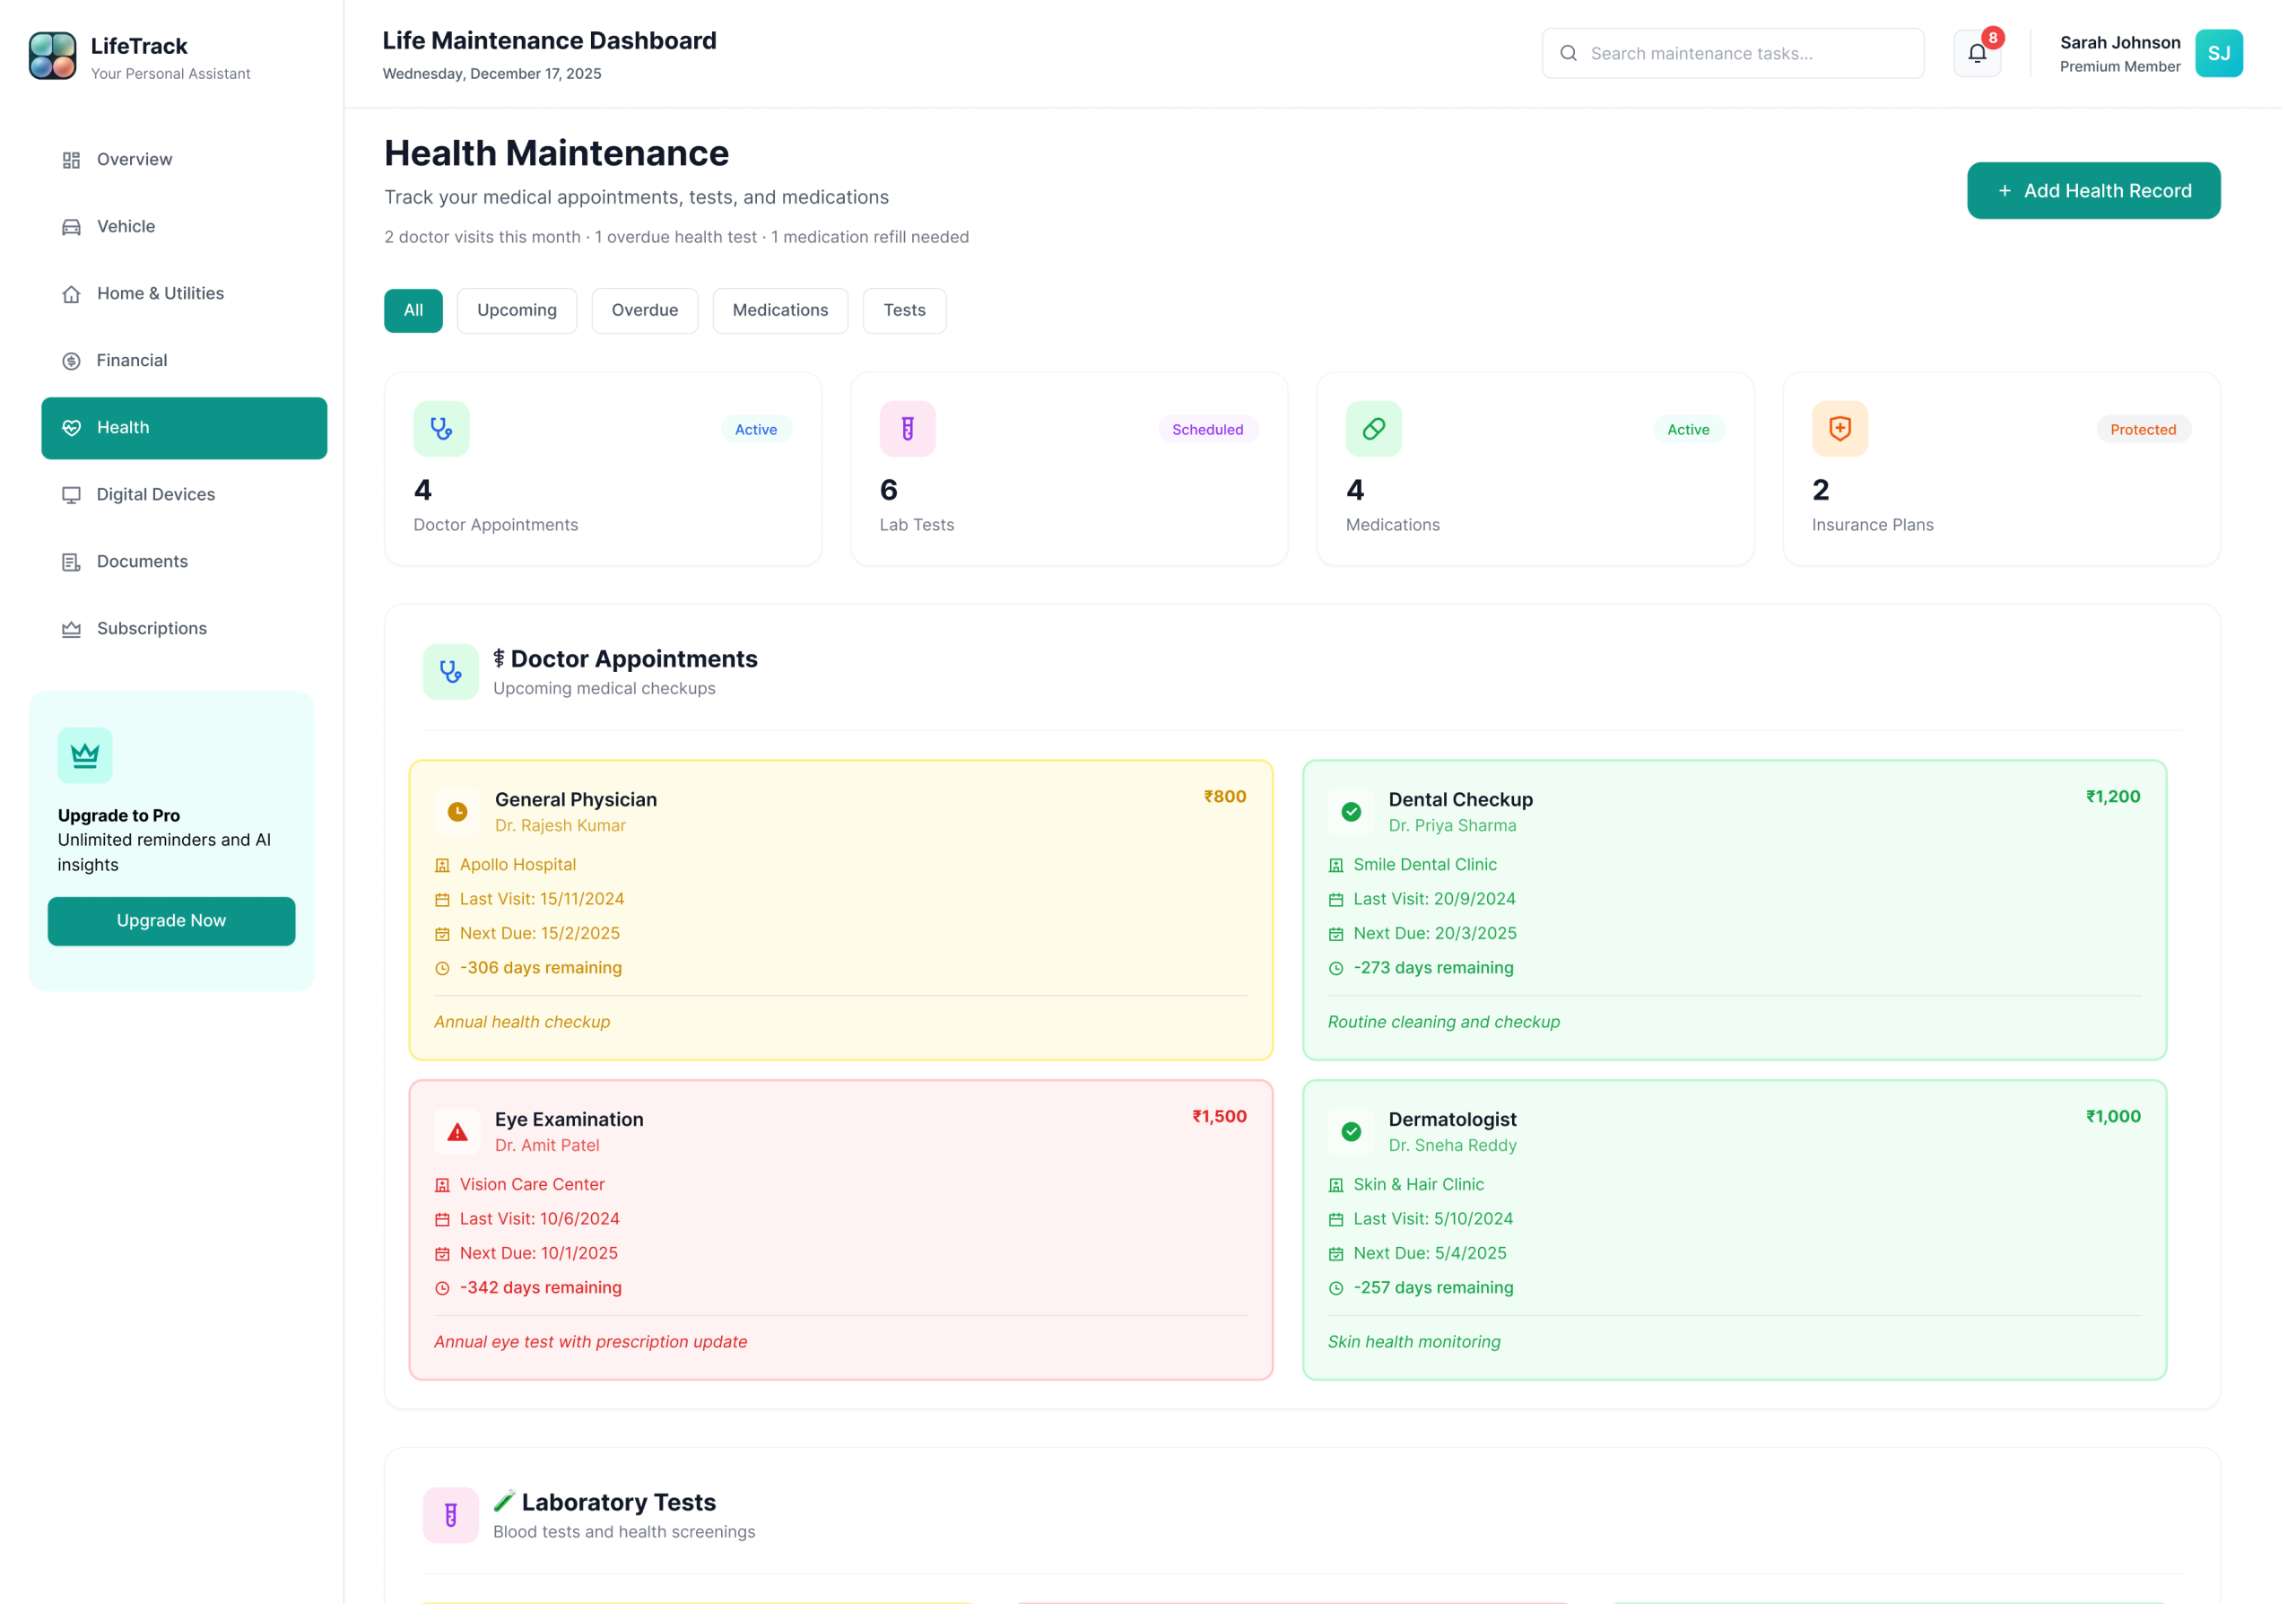
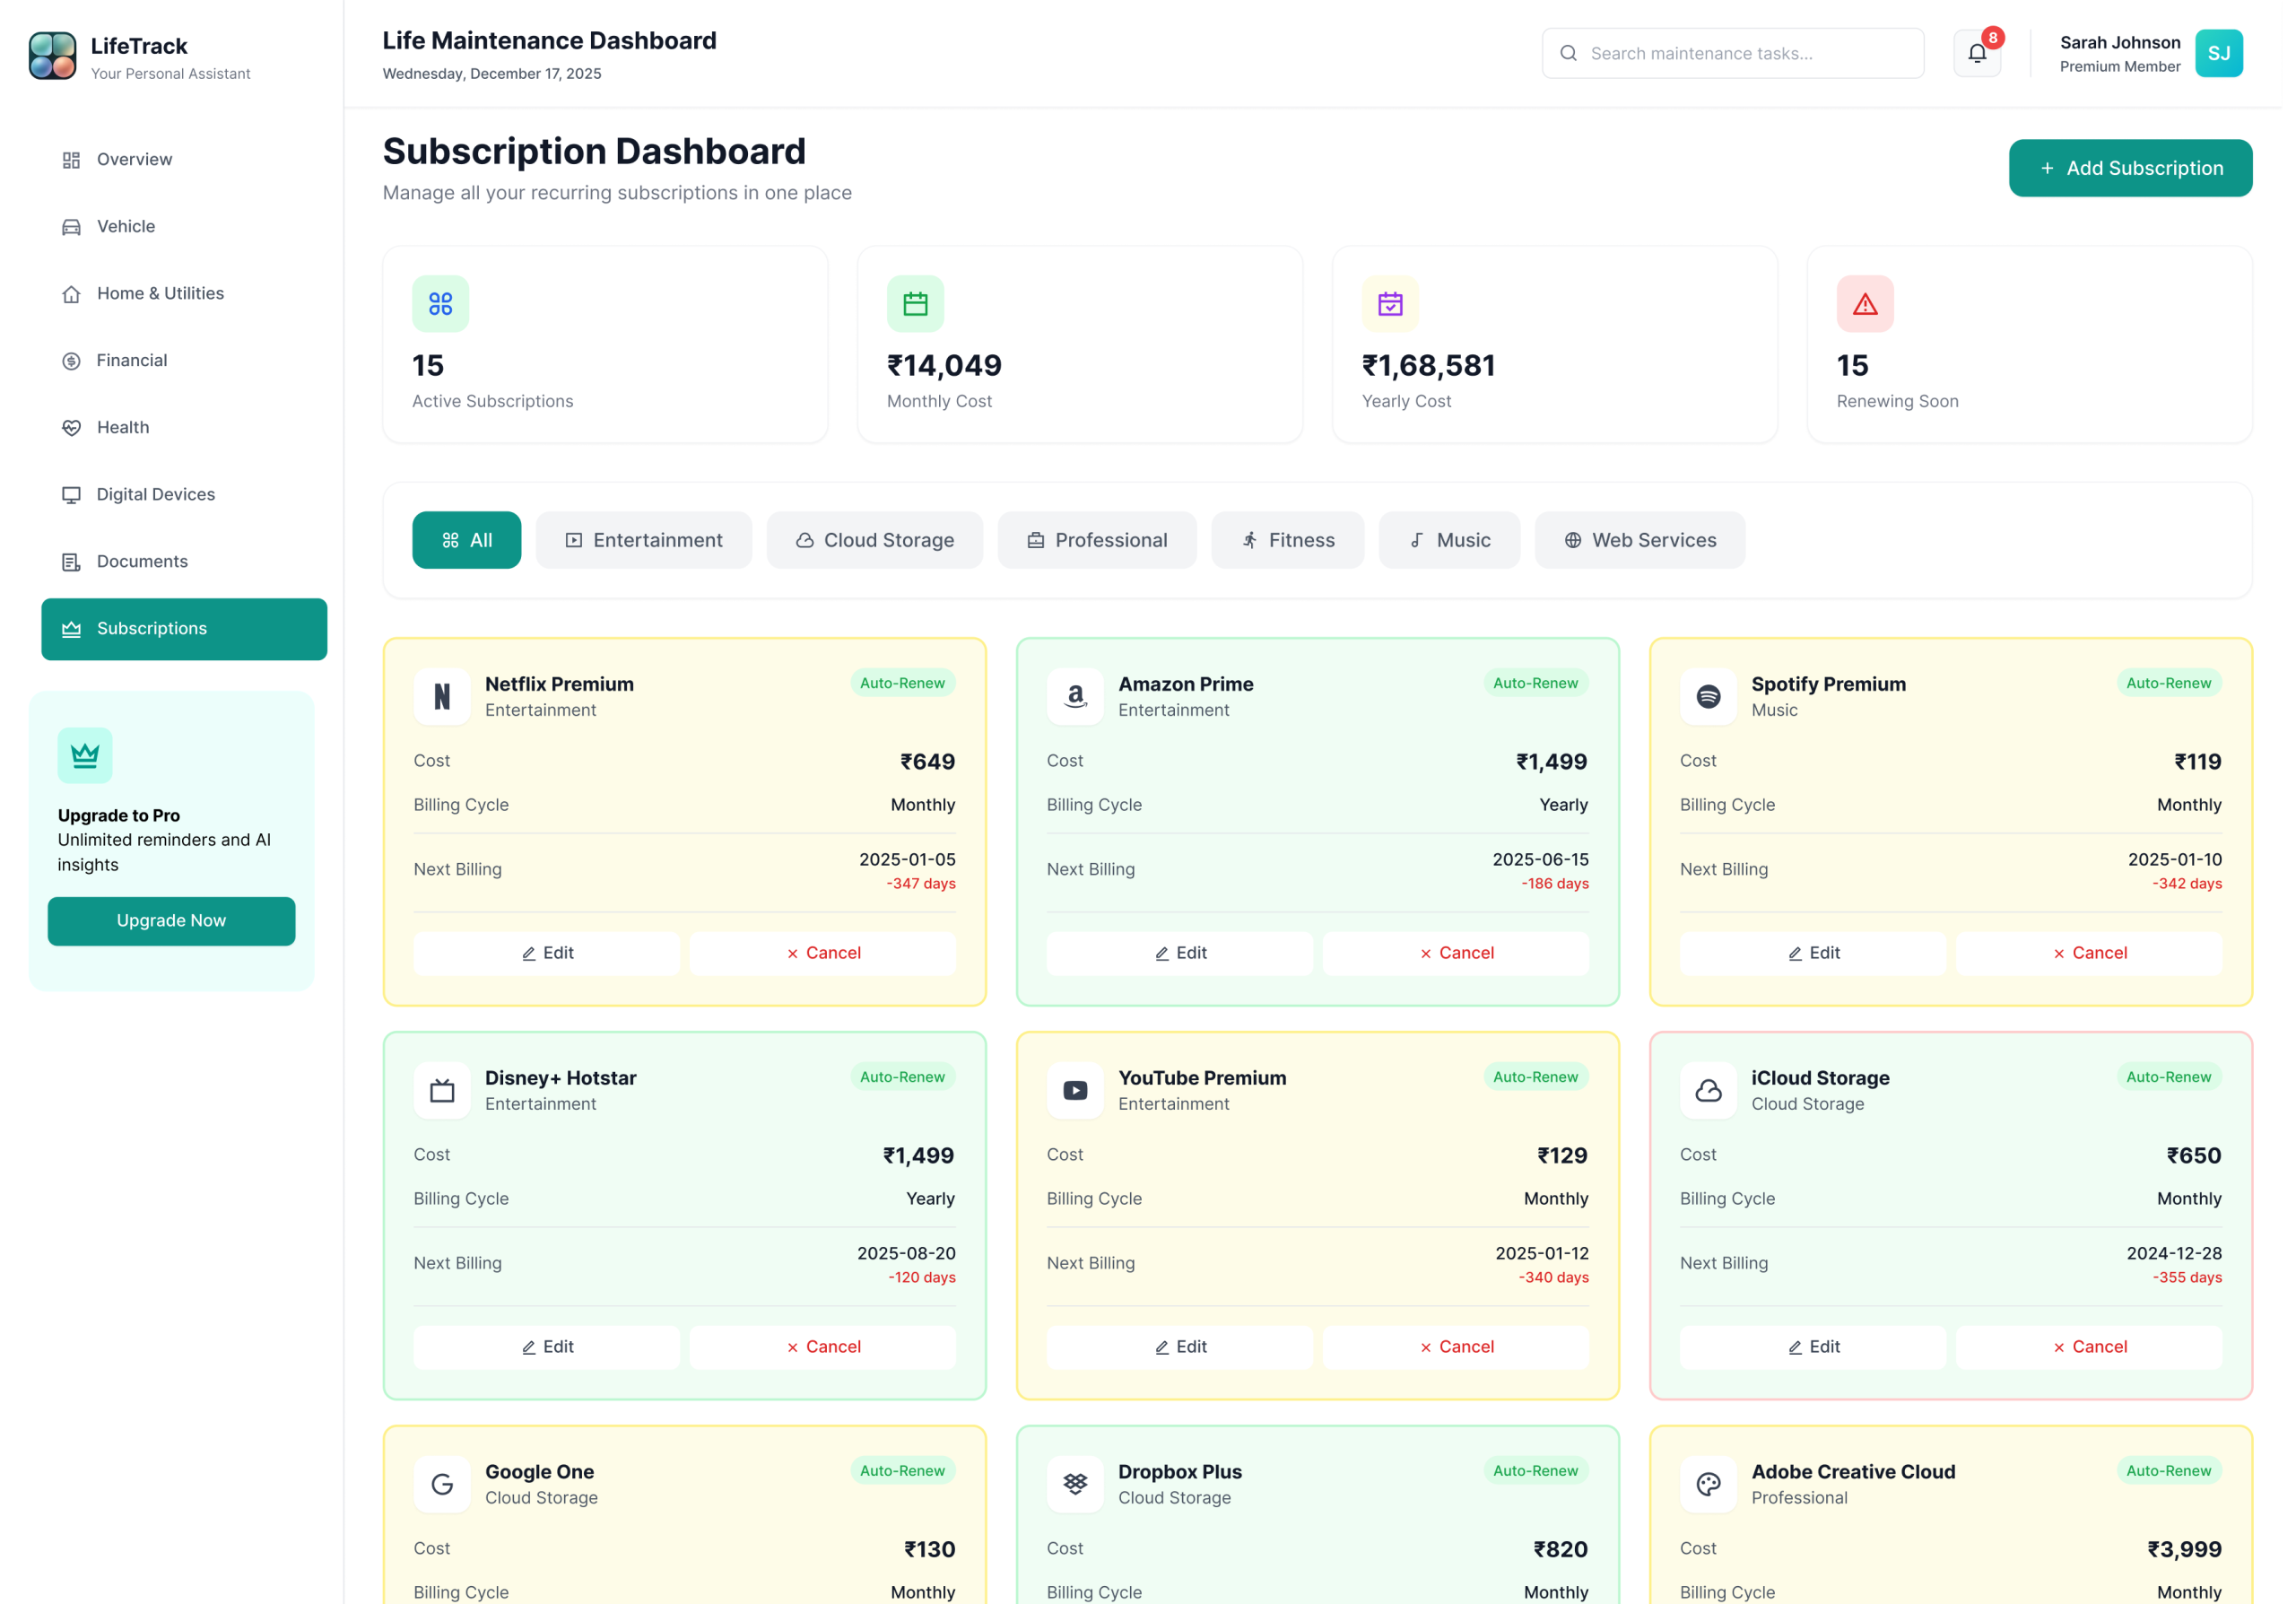
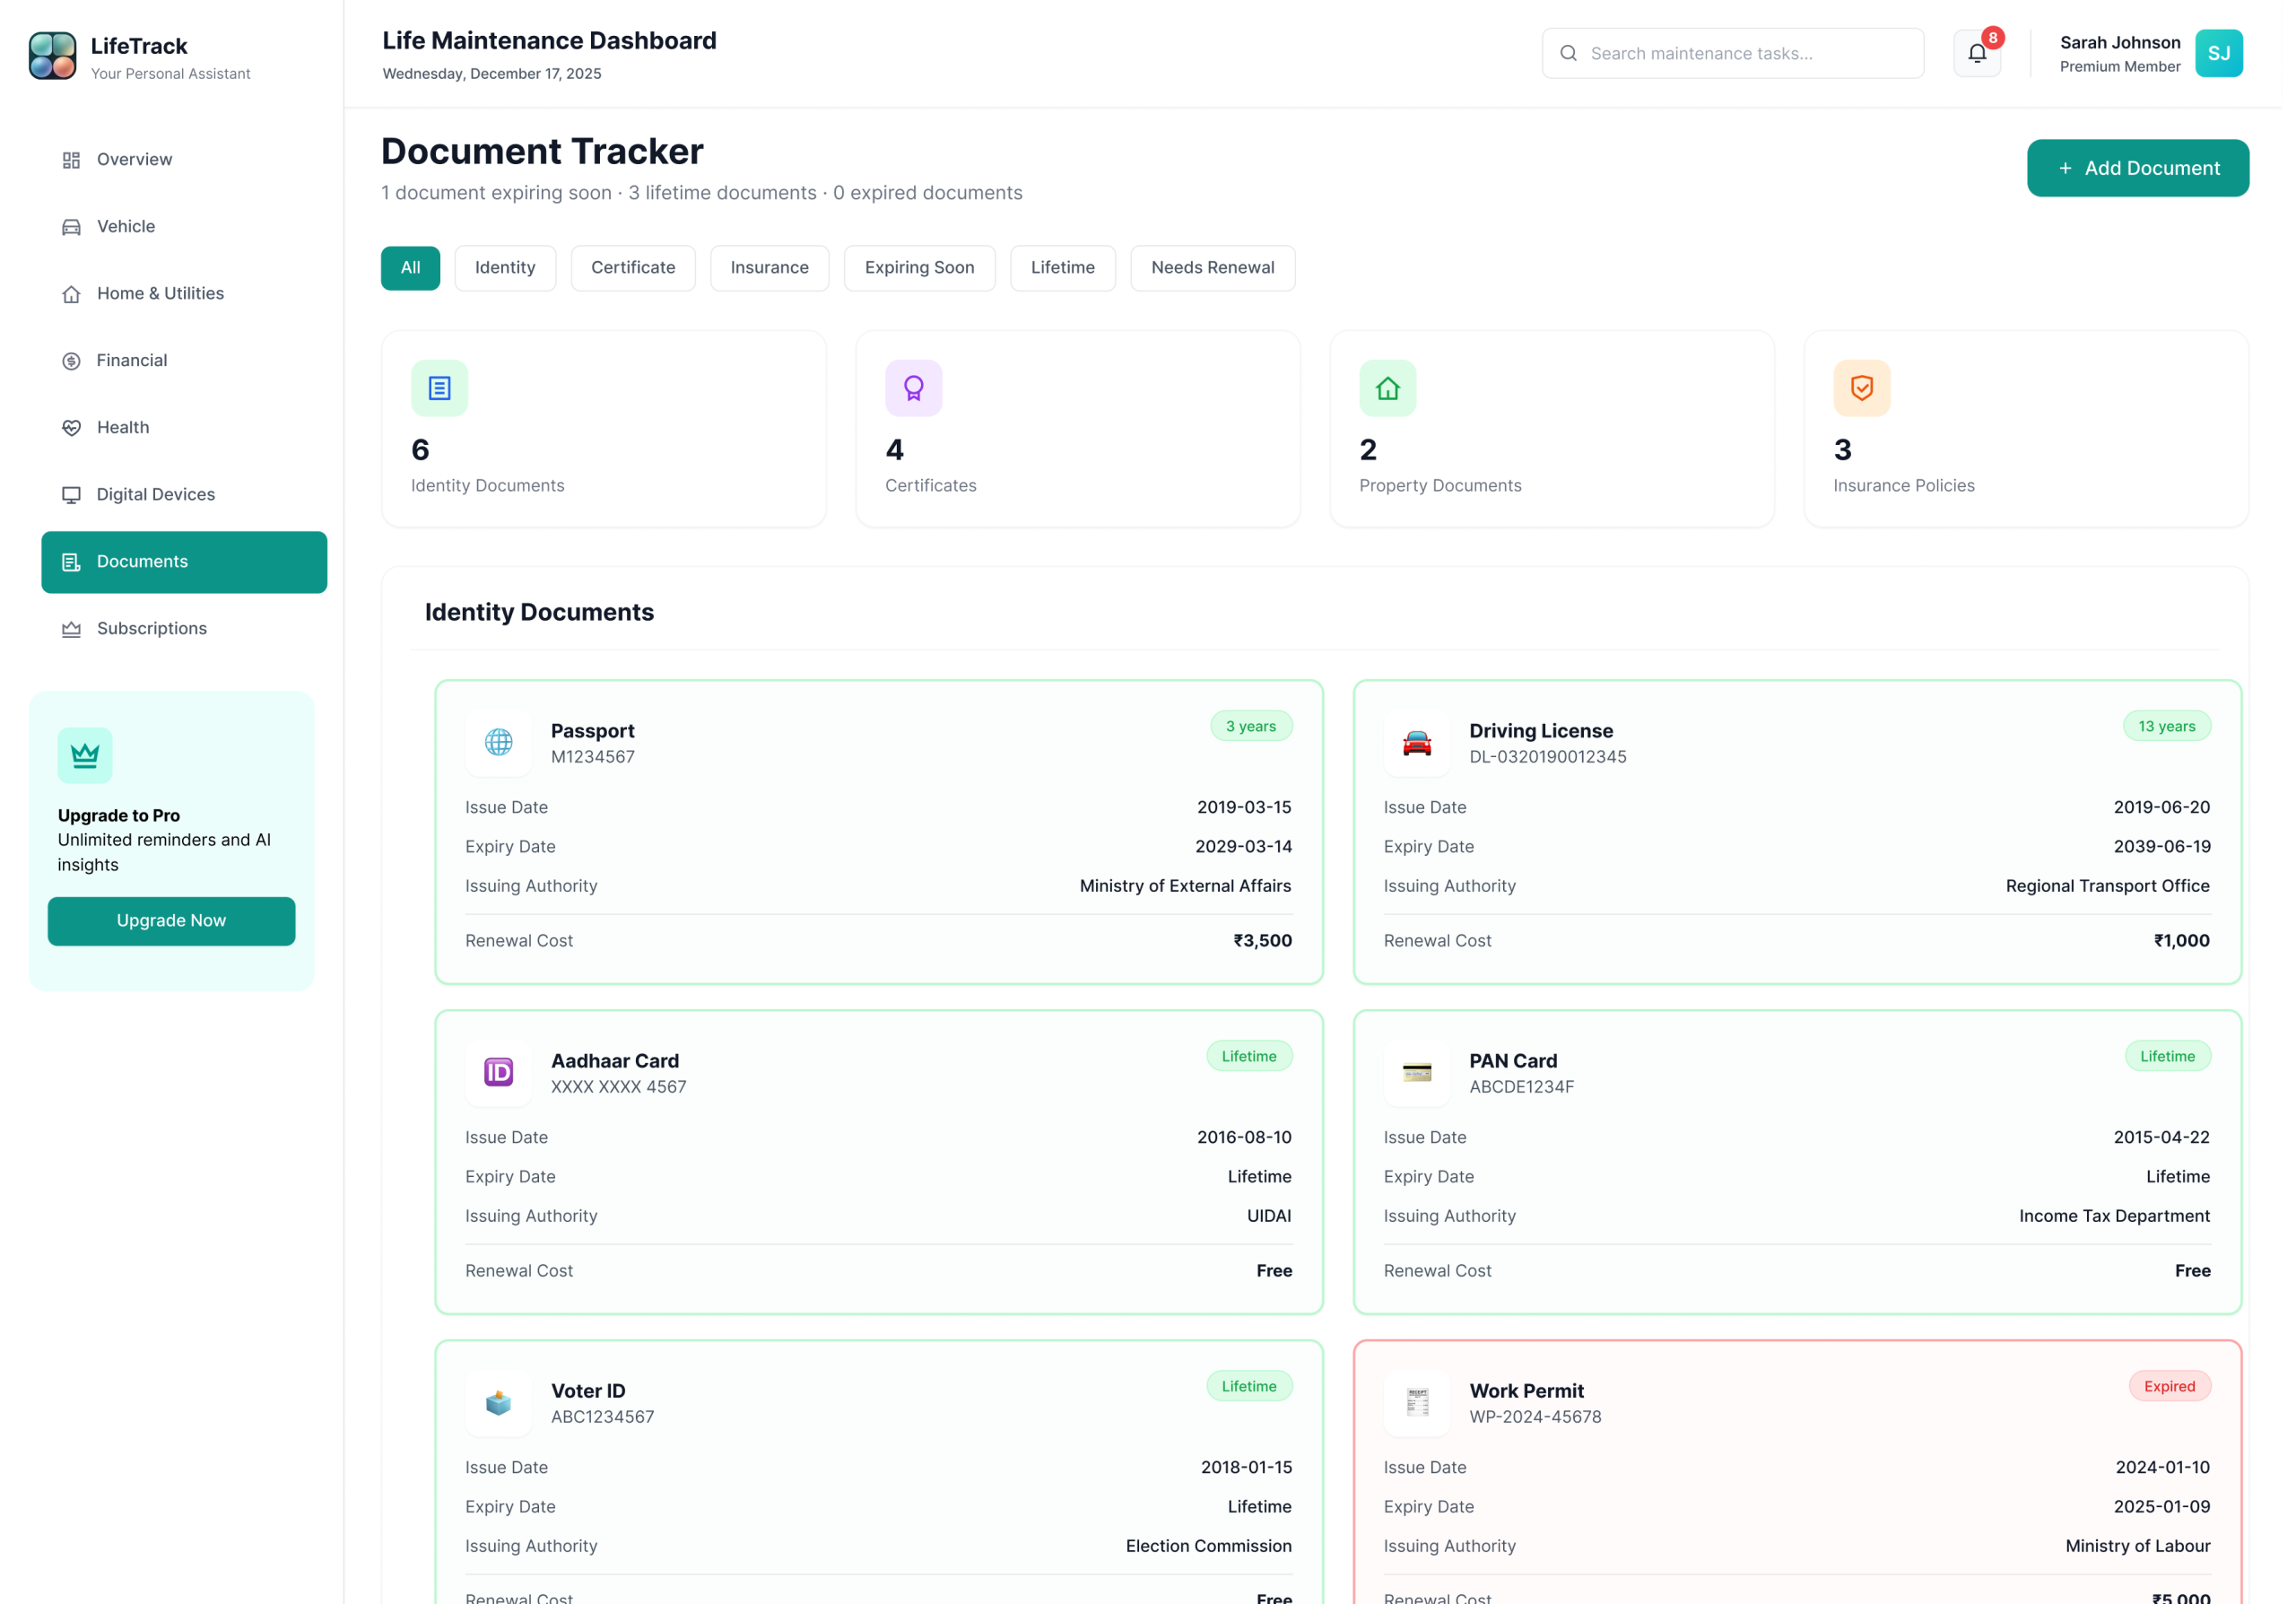
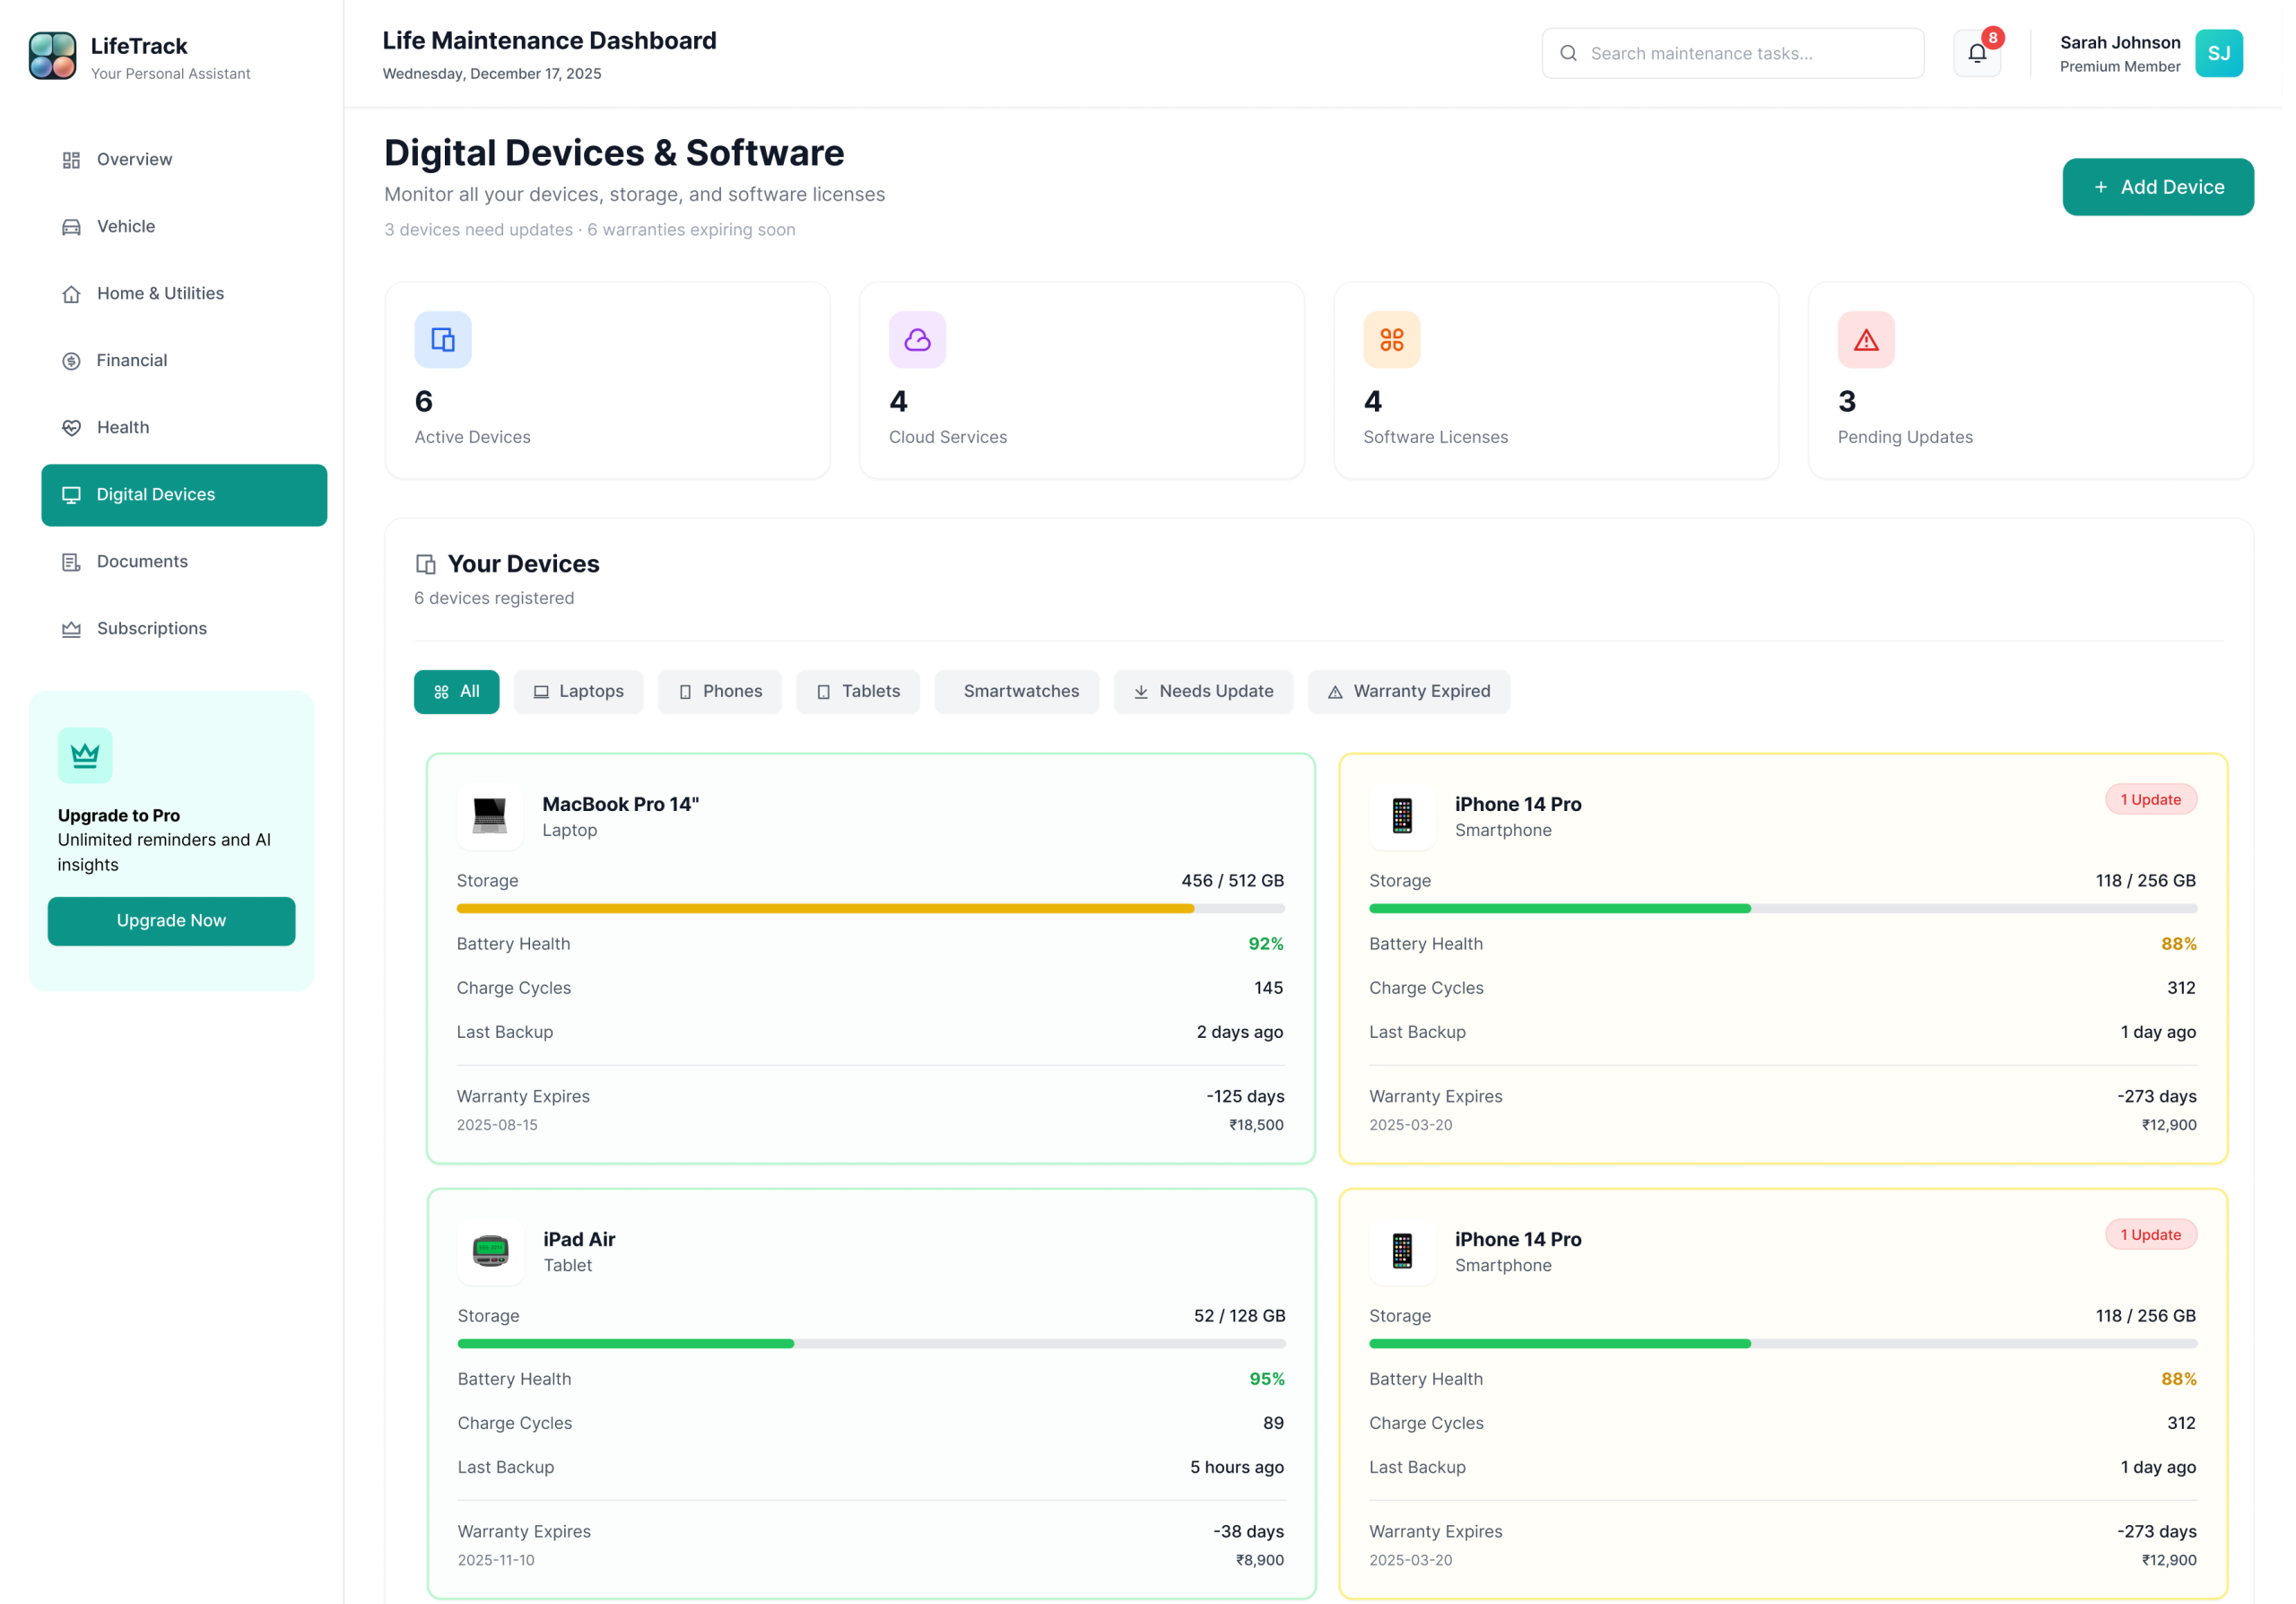
Every module follows the same card-based layout, status badge system, and quick-action pattern. Consistency is the feature — users never have to relearn the interface when they switch from Finance to Health to Vehicles.
A system built for calm clarity.
Every colour, typeface, and component decision made to reduce cognitive load and build trust with sensitive data
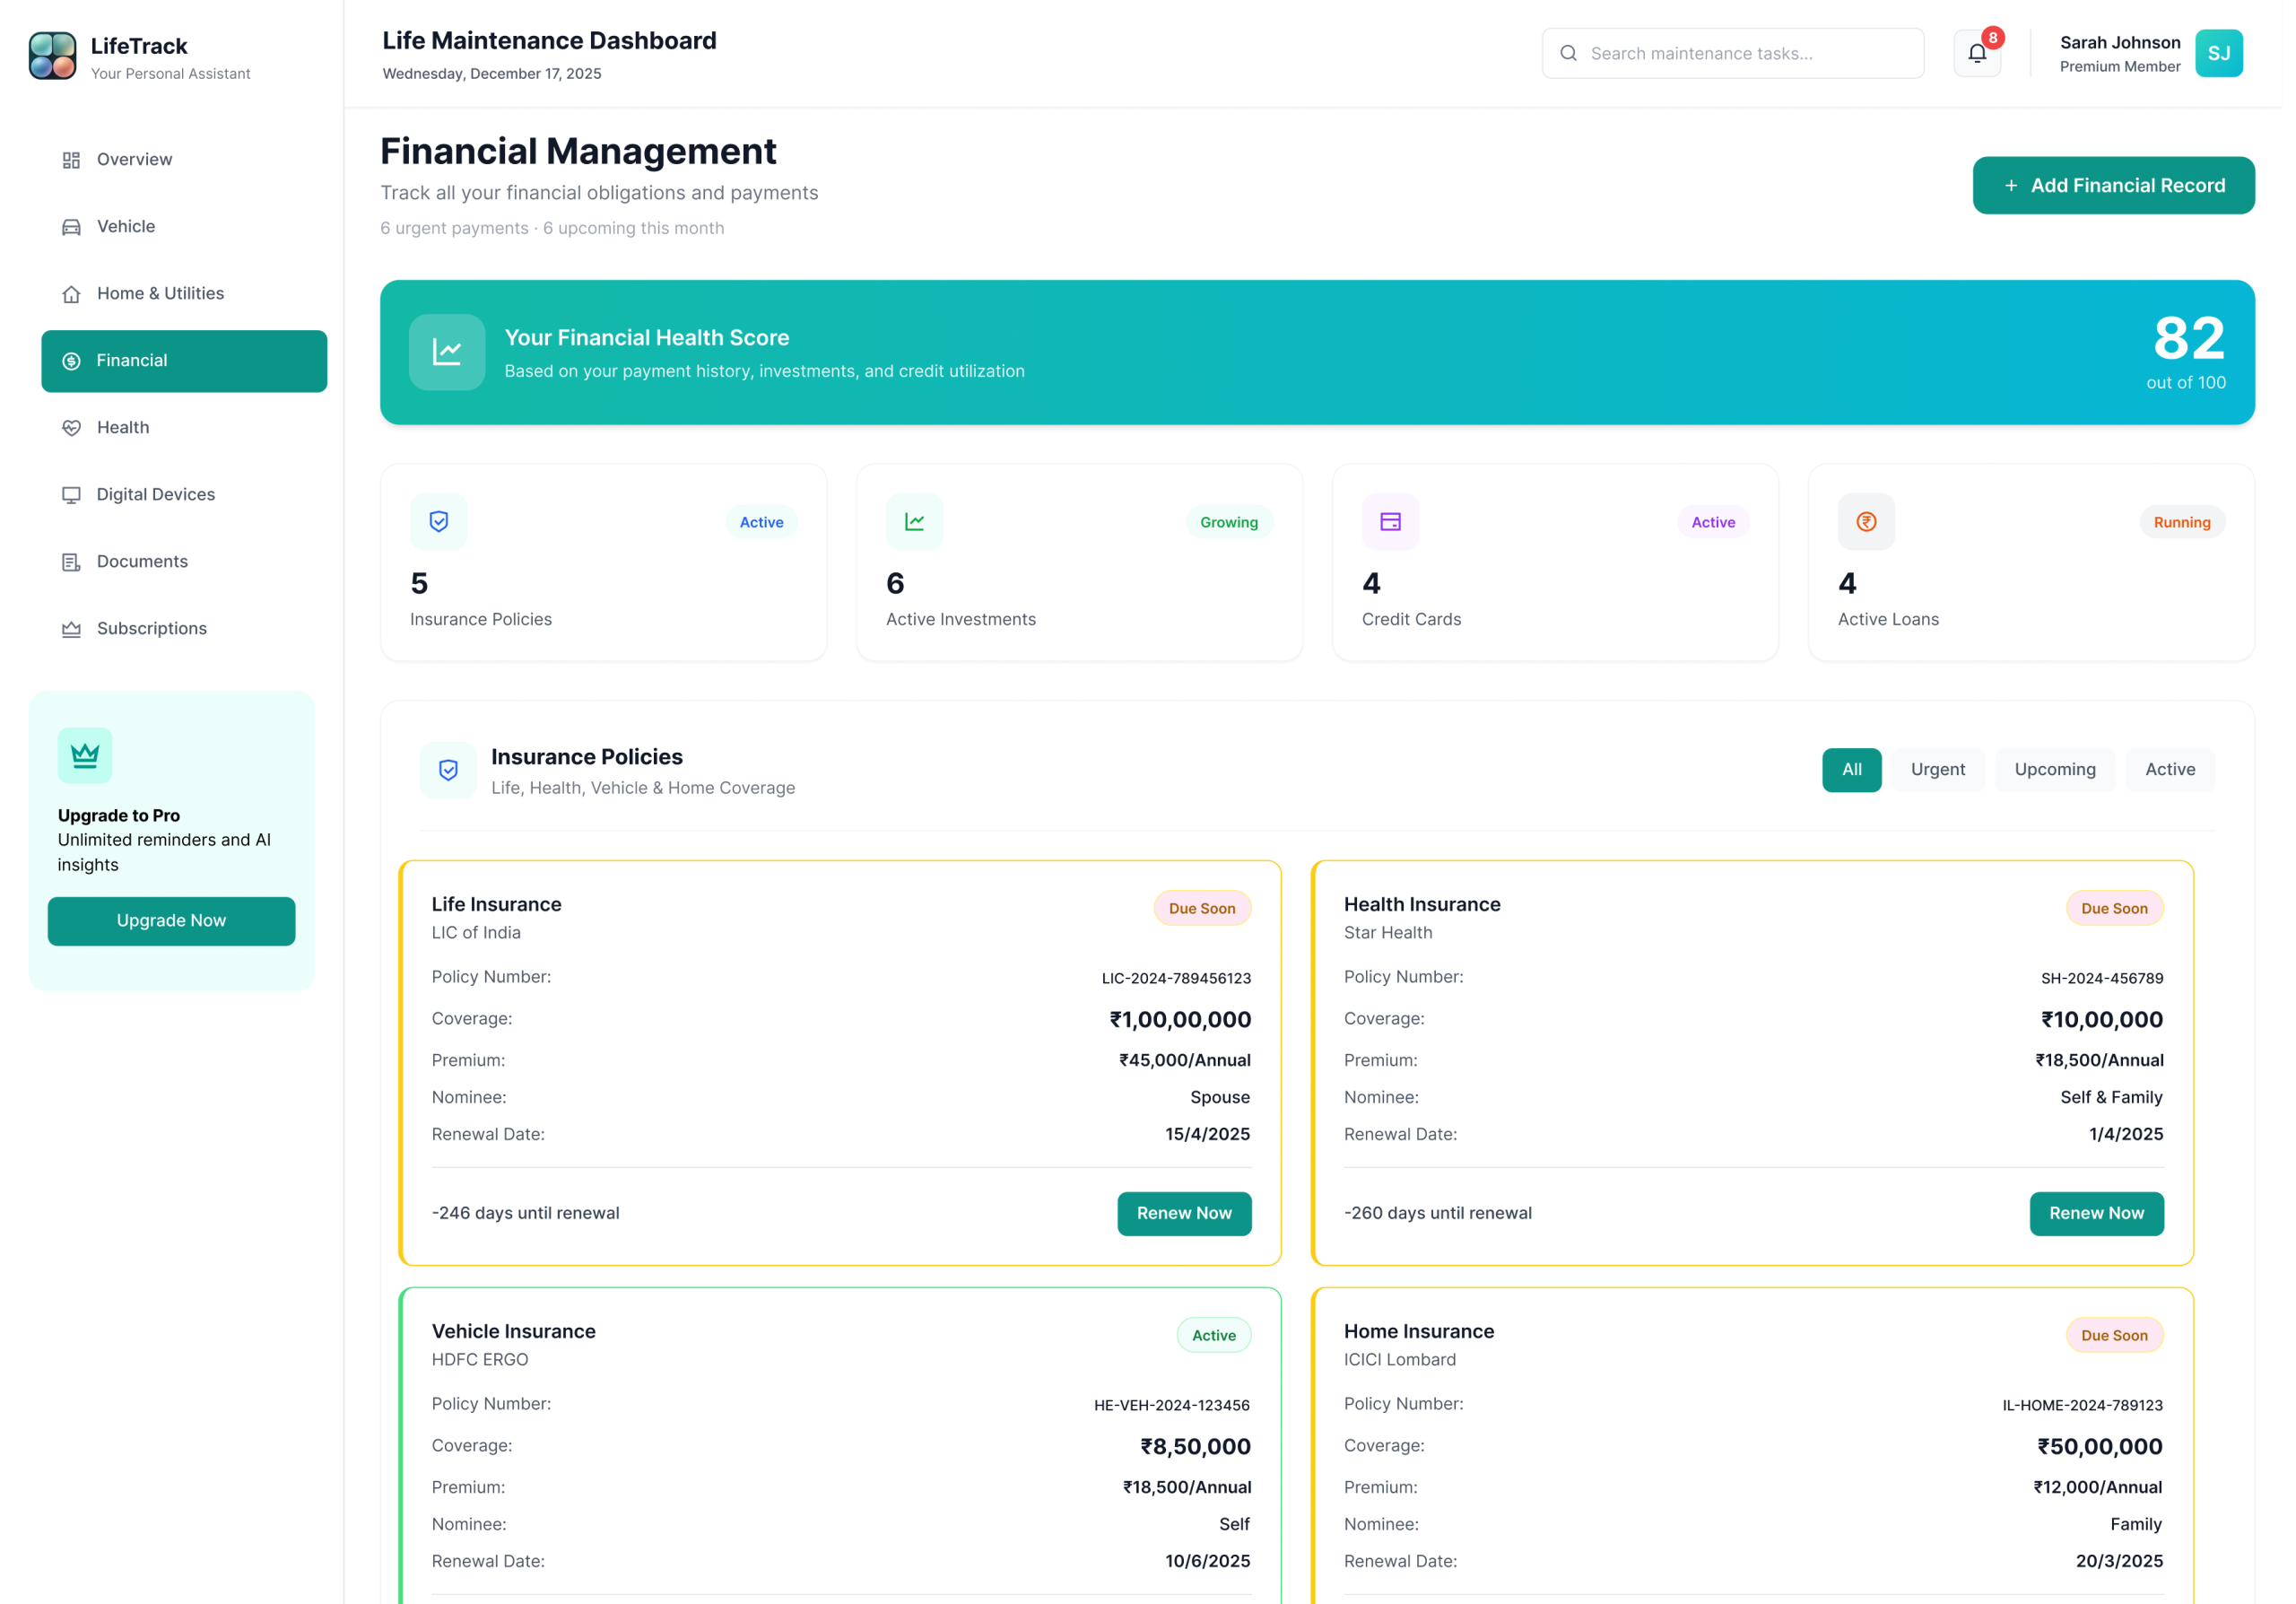
The palette was designed around a core research insight: users dealing with sensitive financial and health data feel more anxious in high-saturation environments. Primary Teal (#14B8A6) sits in a calm, professional register — confident enough to feel trustworthy, muted enough to feel safe. It sits between clinical blue and natural green, suggesting both reliability and forward movement. The status colours follow universal traffic-light mental models, requiring zero learning curve — but are never used alone. Every badge pairs colour + icon + text for full accessibility.
Applied when an item is current, paid, or within a safe window. All three include a label so colour alone is never the only signal.
Attention States — Plan aheadApplied when a deadline is approaching but not yet critical. Due Soon = within 30 days. Upcoming = 31–90 days. Scheduled = appointment confirmed, action may still be needed.
Action Required — Act nowApplied when a deadline has passed (Overdue, Expired) or is within 7 days (Urgent). Cards with these badges surface at the top of the dashboard automatically.
Playfair Display handles display moments and key metrics — giving the dashboard an editorial quality that lifts it beyond a standard SaaS tool. Plus Jakarta Sans handles all body and UI copy — legible, professional, never clinical. DM Mono carries labels, codes, and metadata. Three typefaces, each with a distinct role — users never have to consciously process which is which, but the tonal shift between them creates hierarchy that guides attention naturally.
Six choices that define LifeTrack
Prototypes are hypotheses. Usability testing is how you find out which hypotheses were wrong. And something is always wrong. The goal isn’t a perfect first design — it’s a better final one.
What testing changed.
Usability sessions, heuristic evaluation, and the four most impactful iterations that shaped the final design
The final design wasn’t just better looking — it was measurably better at its job. The numbers below represent projected outcomes based on usability testing and comparative research — testable against real users in a live beta phase.
Numbers that validated the design.
Projected outcomes from usability testing, user feedback sessions, and comparative analysis — hypotheses to be validated in a live beta phase
“I opened LifeTrack for the first time and immediately knew my car insurance was due in 4 days. I didn’t search. I didn’t scroll. It was just there, at the top, in red. I renewed it in two minutes. That’s never happened before.”
— Usability Test Participant · Software Engineer · Bengaluru · Session 3What LifeTrack taught me.
Six lessons from this project that permanently changed how I approach information-dense design problems
What comes next.
LifeTrack is a concept project. The research phase included 8 informal interviews to inform the design direction. Formal usability testing with a live prototype is the first priority in Days 1–30. The roadmap is sequenced around the riskiest assumptions first — the biggest unknown isn’t the UI, it’s whether users will maintain consistent data entry habits over time.
A comprehensive student management dashboard designed to help learners track progress, manage assignments, access course materials, and stay organized through a clear and intuitive interface.
Let’s work together.
Available for freelance projects, full-time roles, and collaborations. Research-first thinking, clean visual execution, and a genuine love for solving real problems through design.